Data is powerful, but let’s be honest—spreadsheets and walls of text rarely get people excited. If you want your audience to actually stop, read, and remember your message, you need to turn those dry numbers into a visual story. That is where a great infographic comes in.
An infographic does more than just look pretty; it translates complex, heavy data into quick, bite-sized visual insights.
Whether you are designing for social media, a business report, or a blog post, here is a complete breakdown of the essential design elements you need to create professional, highly engaging infographics right here on Pixlaris.
1. Best Data Visualization Formats
The heart of any infographic is the data itself. The goal here is to make numbers readable at a single glance. Instead of listing statistics in a paragraph, use structural layouts that do the heavy lifting for you.
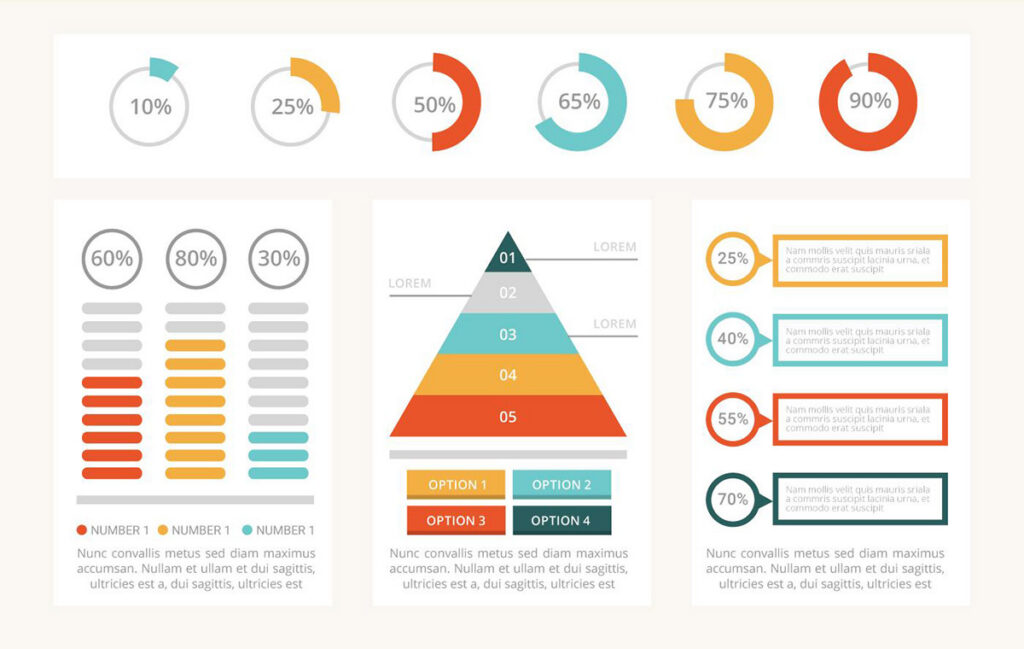
- Smart Charts & Graphs: Bar charts, pie graphics, and progress rings are perfect for showing percentages and comparisons. Keep them clean—remove unnecessary gridlines so the data stands out.
- Chronological Timelines: If you are explaining a brand’s history, a project roadmap, or a step-by-step evolution, a linear timeline guides the reader from point A to point B without confusion.
- Process & Flow Diagrams: Use numbered banners or step-by-step blocks to break down a complicated tutorial or workflow into digestible phases.
2. Using Directional Cues for Better Layouts
An infographic should feel like a journey. If a reader doesn’t know where to look next, they will click away. You need to subtly guide their eyes down the page.
- Directional Indicators: Use clean arrows, dashed lines, or subtle geometric pointers to connect one idea to the next.
- Callout Elements: Use speech bubbles, quote boxes, or highlighted text panels to draw attention to your absolute most important takeaway or a killer quote.
- Connective Webs: For abstract concepts, mind-map structures help show how smaller ideas branch out from one central theme.
3. Mastering Negative Space and Content Framing
Without proper framing, your infographic can quickly look like a cluttered mess. Content containers act as the “shelves” of your design, keeping everything organized and neat.
- Geometric Framing: Use clean rectangles, circles, or rounded cards to group related text and icons together. This creates an immediate sense of organization.
- Visual Dividers: Instead of harsh black lines, use creative spacing, subtle color shifts, or stylized borders to separate different sections of your graphic.
- Negative Space: Don’t be afraid of empty space! Leaving breathing room around your text and data blocks prevents the design from feeling overwhelming.
4. Selecting the Right Infographic Icons
Icons are the universal shorthand of design. They add instant personality and context, allowing your audience to understand the topic before they even read a single word. Depending on your niche, lean into tailored visual sets:
| Industry | Visual Elements to Use |
| Business & Strategy | Growth charts, briefcases, lightbulbs, currency symbols, and teamwork graphics. |
| Marketing & Social Media | Megaphones, target reticles, smartphone frames, engagement rings/hearts, and click mouse icons. |
| Health & Wellness | Heartbeats, vitamins, organic leaves, dumbbells, and clean medical cross symbols. |
| Education & Learning | Graduation caps, open books, pencils, lightbulbs, and achievement badges. |
Create Stunning Visual Content with Pixlaris
You don’t need to be a veteran graphic designer to create stunning visual content. A great infographic simply requires clear data, a logical flow, and the right tools to piece it all together.
With the flexible layout tools, vibrant color palettes, and modern asset libraries available on Pixlaris, you have everything you need to transform raw information into a beautiful visual masterpiece. Sign in today, open a blank canvas, and start building your next viral graphic!